Detecting cause of problem that occurs only in production environment is hard. For Visual C++ created native windows application, this can be done using DebugDiag tool.
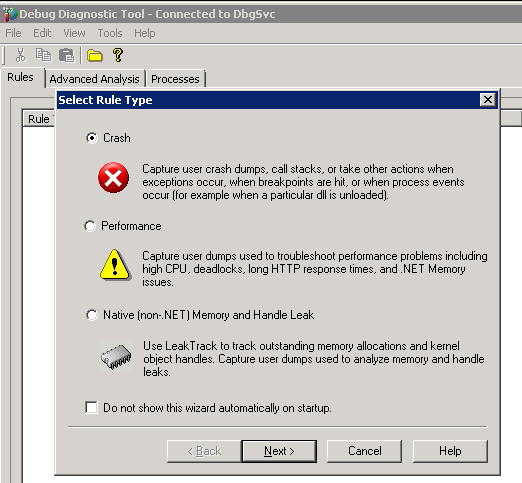
Download and install the tool on the production server, run it, and create a Crash rule type
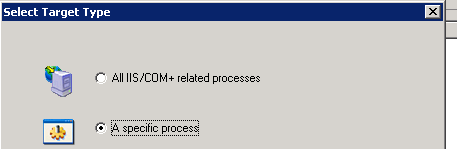
Select a specific process target:
And search for your process
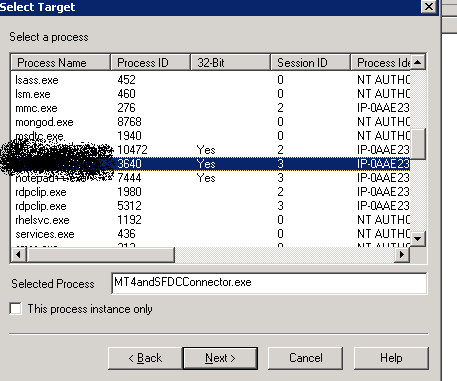
Tick This process instance only if multiple processes with same name are running but you’re only interested in one.
Click next and accept all defaults. Then when the crash occurs, you will get a .dmp file on C:\Program Files\DebugDiag\Logs\Crash rule for process id NNNN folder.
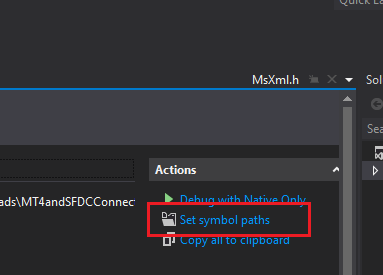
This .dmp file can be copied into your PC and opened in Visual Studio for stack trace analysis. Don’t forget you need to tell Visual Studio where to find the symbol (.pdb) file.
Select Set symbol paths on Visual Studio Action bar and add the folder containing your .pdb file.
Then start the debugging session by selecting Debug with Native Only. Visual Studio will tell you the stack trace when the crash happens.
Thanks to Ganesh R for providing this solution on Stack Overflow.
Also checkout Microsoft’s documentation on DebugDiag.