- Ensure you have ZEROMQ_HOME environment variable pointing to the root source package (and compiled jars/dlls). See the compilation guide for more info.
- Ensure %ZEROMQ_HOME%\java\lib\zeromq.jar is on the classpath. The best way to achieve this if you’re using Maven is to deploy it to your internal repository so your work colleague can reference it directly.
To deploy to internal maven repo:
C:\> cd %ZEROMQ_HOME%\java\lib

C:\zeromq-4.0.5\java\lib> mvn deploy:deploy-file -Dfile=zmq.jar -DgroupId=my.company.zmq -DartifactId=zmq -Dversion=3.1.0 Durl=file:////path/to/my/company/maven_repository
To add this dependency on your project, add this to your pom.xml:
my.company.zmq zmq 3.1.0 my-company-internal file:////path/to/my/company/maven_repository - Set java system property java.library.path to %ZEROMQ_HOME%\java\lib. Note that java doesn’t accept environment variable, so you have to resolve it yourself. If you’re running through command line:
C:\> java -Djava.library.path=C:\zeromq-4.0.5\java\lib
On application servers like tomcat, you’ll have to edit the start script or the Windows service configuration. This system property has to be set before runtime starts, doing System.setProperty(key, value) will not work.
- Add %ZEROMQ_HOME%\bin\x64 to PATH env var:
C:\>SET PATH=%ZEROMQ_HOME%\bin\x64;%PATH%
If deploying on production server, this need to be done via Windows Advanced System Configuration. Make sure you restart any VM so it can pick up the latest env vars
- If you’re deploying on production environment, only following folder layout is required:
C:\zeromq-4.0.5
 +- bin
     +- x64
         +- libzmq.dll
 +- java
     +- lib
         +- jzmq.dll
Category Archives: c++
ZeroMQ Windows Java Binding: Building libzmq.dll, jzmq.dll and zmq.jar Using Visual Studio 2012
Versions used in this article:
- jzmq-3.1.0
- ZeroMQ-4.0.5 source
- jdk 1.6.0 (Update 34), Windows 64bit
- Visual Studio 2012
- Windows 7 64bit
Build Steps
- Download , inflate it to C:\zeromq-4.0.5 (or other folder to your liking). Set your ZEROMQ_HOME environment variable pointing to this folder.
- Download , inflate it to %ZEROMQ_HOME%\java
- On %ZEROMQ_HOME%, open Visual Studio solution file builds\msvc\msvc10.sln. Switch the active profile to Release, and platform to x64. Perform Build Solution (F7). If successful you should get bin\x64\libzmq.dll
- On %ZEROMQ_HOME%\java, open Visual Studio solution file builds\msvc\msvc.sln. Switch the profile into Release
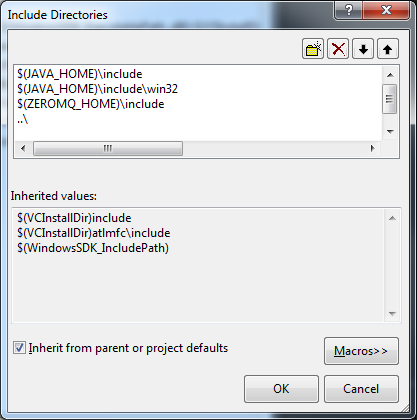
- Go to jzmq project property, edit the VC++ Directories. The include path has to correctly reference your jdk path (you can use environment variable like $(JAVA_HOME)). Similarly it also need reference to $(ZEROMQ_HOME)\include and ..\. ..\ is required so reference to config.hpp is not broken. Your Include Directories should end up similar like this:
- Edit the Library Directories, and add $(JAVA_HOME)\lib and $(ZEROMQ_HOME)\lib. Your Library Directories should end up similar like this:

- Do solution build. If all is successful you should end up with jzmq.dll and zmq.jar on %ZEROMQ_HOME%\java\lib
- You can now run the test program as mentioned on ZeroMQ Java Bindings doc:
C:\>cd %ZEROMQ_HOME%\java\src\main\perf

C:\zeromq-4.0.5\java\src\main\perf>set PATH=%ZEROMQ_HOME%\bin\x64;%PATH%

C:\zeromq-4.0.5\java\src\main\perf>java -Djava.library.path=C:\zeromq-4.0.5\java\lib -classpath C:\zeromq-4.0.5\java\lib\zmq.jar;. local_lat tcp://127.0.0.1:5555 1 100
Source code of these sample codes are available on %ZEROMQ_HOME%\java\src\main\perf in case you’re wondering what they do
See Also
Additional References
- ZeroMQ Java Bindings Documentation: http://zeromq.org/bindings:java
- jzmq github site:
Checking for C++ 11 Support
Most c++ compilers define a constant named __cplusplus which indicates C++ 11 support. Hence you can write something like this (thanks Cygon for the SO reply)
#if __cplusplus <= 199711L #error This library needs at least a C++11 compliant compiler #endif [/cpp] On most g++, you can pass -std=c++11 to toggle C++ 11 support:
g++ -std=c++11 main.cpp
This is what I get when I try to output the __cplusplus constant with the flag set:
#include
using namespace std;
int main() {
cout << __cplusplus << endl; return 0; } [/cpp] [text] $ g++ -std=c++11 test.cpp $ ./a.out 201103 [/text] Visual C++ compiler version 2012 or above should come with near-complete C++ 11 support.
Working With Time In C++
Working with time with any programming language is always tricky, C++ is no exception.
Getting Current Time
Use the time function to get the current time. Note that time_t has no timezone information, it’s simply UTC offset from epoch (1 January 1970 00:00:00). In most platform it’s stored as 8 bytes integer.
#includeint main(int argc, char** argv) { time_t now; time(&now); return 0; }
Formatting / Printing Time
Use C-style strftime function to format time. Note that strftime takes a struct tm * as parameter, so we have to first convert the time_t. Use localtime to convert it into local time zone.
struct tm * now_tm = localtime(&now);
char now_str[100];
strftime(now_str, sizeof(now_str), “%F %T %z”, now_tm);
cout << now_str << endl [/cpp] The above pattern string will produce a time format like this: [text] 2015-03-12 12:11:45 +1000 [/text] strftime man page has an excellent explanation of the pattern string. If you want to convert into GMT timezone you can also use gmtime
Parsing Time
This is where things get even more trickier. Not until C++11 standard the language come with a built-in way to parse time strings. Prior to that you have to either write your own parsing function or use 3rd party library like boost.
Check here how to enable C++11 in your toolset.
The new C++11 standard comes with get_time function which can be used to parse string into a struct tm:
#include
#include
#include
using namespace std;
int main() {
struct tm tt;
cout << "enter time in YYYY-MM-DD HH:mm format: "; cin >> get_time(&tt, “%Y-%m-%d %H:%M”);
cout << put_time(&tt, “%d %b %Y, %H:%M %z\n”); return 0; } [/cpp] This code will produce output like this: [text] $ ./a.out enter time in YYYY-MM-DD HH:mm format: 2015-06-11 23:44 11 Jun 2015, 23:44 +1000 [/text]
Setting Up ZeroMQ C++ On Visual Studio
This article is tested against following version / configuration:
- Visual Studio 2012 (V110) Platform Toolset
- Win32
- ZeroMQ 4.0.4
- Runtime Library: Multi-threaded DLL (/MD)
Steps to setup ZeroMQ on a Visual Studio C++ project:
- Download and install ZeroMQ-4.0.4~miru1.0-x86.exe (or newer) from http://zeromq.org/distro:microsoft-windows
- Set ZEROMQ_HOME environment variable to C:\Program Files (x86)\ZeroMQ 4.0.4 (or wherever you installed it to)
- On Visual Studio project configuration, add $(ZEROMQ_HOME)\include to Configuration Properties -> VC++ Directories. Don’t forget to restart Visual Studio so it picks up the new environment variable
- Add $(ZEROMQ_HOME)\lib to Linker -> General -> Additional Library Directories
- Add libzmq-v110-mt-4_0_4.lib to Linker -> Input -> Additional Dependencies
- Get a copy of zmq.hpp from , place this somewhere on your project. This header file references zmq.h located at $(ZEROMQ_HOME)\include
- Once you’ve compiled your executable, place libzmq-v110-mt-4_0_4.dll on the same folder, otherwise ZeroMQ initialisation will cause runtime crash
And finally take a look at some excellent tutorial examples from zeromq.org website to get you started, in particular:
- Ask And Ye Shall Receive: Request – Reply pattern example
- Getting the Message Out: Publisher – Subscriber pattern example
See Also
Debugging Visual C++ DLL Without Host Application EXE Source Code
Here’s our situation, the 3rd party app we’re using in our company can be customized by loading a DLL into it, but we (obviously) cannot see the source code of the host exe program, we only have access to our DLL’s source code. The problem is how to debug our DLL when crashes occured?
Yes it’s unfortunate, if the DLL did cause a crash the host exe will go down together with it. Luckily the host exe record some kind of stack trace when it crashed, here’s what it looked like (let’s call our DLL cricket.dll to simplify things):
Filename    : *******
Time        : 2014.11.13 18:41 (74:37:03 elapsed)
Program     : ******
Version     : ******
Revision    : ******
OS          : Windows 7 Server 6.1 Service Pack 1 (Build 7601)
BIOS        : DELL   - 1 - PowerEdge R420
Explorer    : 9.11
ID          :
Processors  : 24 x Intel Xeon  E5-2420 0 @ 1.90GHz
Computer    : LIVE-SERVER-1:WORKGROUP
Memory      : 29253 free of 32690 Mb
Virtual     : 2639 free of 4095 Mb
Handlers    : 14569
Path        : D:********
Disk D:     : 169325 Mb of 224999 Mb free
Exception   : C0000005 at 70606D91 read to 1FAF001A

Modules     : 01080000 009DD000 d:************.exe (*****)
            : 775A0000 00180000 c:\windows\syswow64\ntdll.dll (6.1.7601.18247)
            : 76EB0000 00110000 c:\windows\syswow64\kernel32.dll (6.1.7601.18409)
....
            : 705F0000 00047000 cricket.dll
Pay particular attention to the Modules section at the bottom. This tells us specific address in memory where our dll was loaded by the host exe. This information will be crucial to determine the relative address further down in the stack trace.
In this instance it told us cricket.dll was loaded at 0x705F0000 and it’s of 0x00047000 bytes length.
Further down the massive stack trace, we can see the record of the particular crash-causing thread:
      crash : #213 0002EFF4 EIP: 70606D91 ESP: 23CEF448
              70606D91:000000 [70606D91] unknown (cricket.dll)
              705FF5E1:000000 [705FF5E1] unknown (cricket.dll)
              705F90C9:000000 [705F90C9] unknown (cricket.dll)
              705FF1A2:000000 [705FF1A2] unknown (cricket.dll)
              7060D652:000000 [7060D652] unknown (cricket.dll)
              7060D6D0:000000 [7060D6D0] unknown (cricket.dll)
              76EC3378:000012 [76EC338A] AcquireSRWLockExclusive (kernel32.dll)
              775D9F0F:000063 [775D9F72] RtlInsertElementGenericTableAvl (ntdll.dll)
              775D9F0F:000036 [775D9F45] RtlInsertElementGenericTableAvl (ntdll.dll)

crash -->  70606D91 80780F00          cmp        byte [eax+0xf], 0x0
              70606D95 74EB              jz         0x70606d82

          70606D97 8B8310040000      mov        eax, [ebx+0x410]
          70606D9D 89BD24FDFFFF      mov        [ebp+0xfffffd24], edi
          70606DA3 3BF8              cmp        edi, eax
          70606DA5 740E              jz         0x70606db5

          70606DA7 663B770C          cmp        si, [edi+0xc]
What I really wanted to know here is which line of my source code corresponds to the hex code above? First, find out the relative address. In this circumstances, since the DLL was loaded at 0x705F0000, we have to subtract that amount from the address, so 0x70606D91 - 0x705F0000 (in base 16) is 0x00016D91 (you can pull up Windows calculator, set it to Programmer mode if base 16 math is too hard).
Next, prepare the DLL source code of the same version against that crashed on production environment (git tagging will be very helpful here). This also requires the .pdb file of corresponding DLL which hopefully you’ve saved when releasing the code. Keep in mind recompiling the exact same source might produce incompatible .pdb.
Drop the .pdb file into your Release folder, and from Visual Studio select Debug -> Attach to Process... It’ll be easier if you run the exe locally loaded with the exact same DLL that crashed.
Next you’ll need to translate the relative address into the local address of the exe your debugger is attached to. To do this:
- Open the Modules window (Debug -> Windows -> Modules)
- Find your DLL, take note of its start address
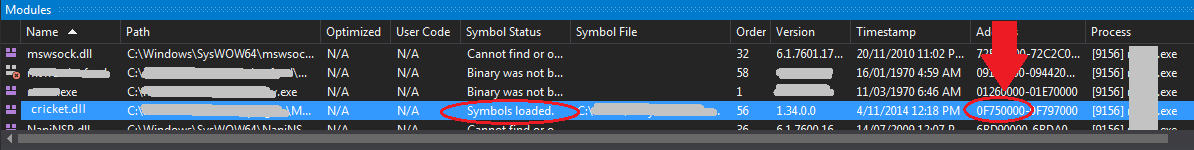
Here my local DLL is loaded at 0F75000, so I just need to add that to the relative address to localize it: 0x0F75000 + 0x0x00016D91 = 0x0F766D91
Next is to find the source code corresponding to that address:
- Open Debug -> Windows -> Disassembly
- On the address bar, input the localized address 0x0F766D91
- Right click on the line, and select Go to Source
- Voila! You’ve managed locate the culprit line, now do this for the other location on the stack trace too

Big thanks to SO community for helping me with this technique.
Storing Currency Into Floating Point Type Is Not A Good Idea
Storing currency into a floating-point type seem to be the most intuitive thing to do, especially most major currency are displayed as fraction to the cents, eg: $10.50. However floating-point is designed to store fraction up into specific precision, but currency is only subdivisible until a certain amount. For example the smallest fraction is US Dollar is 1 cent, Australian Dollar 5 cent and so on. Hmm, now it sounded like storing them as integer made much more sense!
Here’s one problem I came accross recently: split a sum of money proportionally into N people. That sounded simple, until I realize if the sum cannot be divided equally, you need to take into account roundings and who get lucky to receive the remainder.
For example: divide $10 into 3 people. Each person will get $31/3.. but the problem is there isn’t any $1/3 in real life (at least in all dollar currencies I know of).
At first.. I thought I can implement the code like this:
double amount = 10.0;

double person_a = amount / 3.0;
double person_b = amount / 3.0;
double person_c = amount / 3.0;

printf("person a: $%.2f\n", person_a); // This prints the double value rounded to 2 digits after decimal
printf("person b: $%.2f\n", person_b);
printf("person c: $%.2f\n", person_c);
But this code gives me
person a: $3.33
person b: $3.33
person c: $3.33
Hey the total is only $9.99 where do the 1 cent go?
Obviously this is a rounding problem. 10.0 / 3.0 gives 3.3333333… (up until the limit of double precision), but when rounded into 3.33, we lost 0.0033333…..
Probably a more appropriate code to solve this problem is as follows:
int amount = 1000; // <– That is 1000 cents, ie: 10 dollar int remainder = 1000 % 3; int person_a = amount / 3; int person_b = amount / 3; int person_c = amount / 3; printf(“person a: %.2f\n”, person_a / 100.0); printf(“person b: %.2f\n”, person_b / 100.0); printf(“person c: %.2f\n”, person_c / 100.0); printf(“$%.2f remaining, who’s the lucky person?\n”, remainder / 100.0); [/c] Which gives: [text] person a: $3.33 person b: $3.33 person c: $3.33 $0.01 remaining, who’s the lucky person? [/text]
Using Boost Logging
Simple std::cout works great but there are few problems:
- Logging output only goes to console
- If program runs for a long time via cron / scheduler then output has to be redirected to a file
- Doing so might cause a large log with filesystem lock for which the program has to be stopped before it can be cleaned
Here’s how to use the Boost Logging library:
#include
#include “boost/log/trivial.hpp”
#include “boost/log/utility/setup.hpp”
using namespace std;
int main() {
// Output message to console
boost::log::add_console_log(
cout,
boost::log::keywords::format = “[%TimeStamp%]: %Message%”,
boost::log::keywords::auto_flush = true
);
// Output message to file, rotates when file reached 1mb or at midnight every day. Each log file
// is capped at 1mb and total is 20mb
boost::log::add_file_log (
boost::log::keywords::file_name = “MyApp_%3N.log”,
boost::log::keywords::rotation_size = 1 * 1024 * 1024,
boost::log::keywords::max_size = 20 * 1024 * 1024,
boost::log::keywords::time_based_rotation = boost::log::sinks::file::rotation_at_time_point(0, 0, 0),
boost::log::keywords::format = “[%TimeStamp%]: %Message%”,
boost::log::keywords::auto_flush = true
);
boost::log::add_common_attributes();
// Only output message with INFO or higher severity
boost::log::core::get()->set_filter(
boost::log::trivial::severity >= boost::log::trivial::info
);
// Output some simple log message
BOOST_LOG_TRIVIAL(trace) << "A trace severity message"; BOOST_LOG_TRIVIAL(debug) << "A debug severity message"; BOOST_LOG_TRIVIAL(info) << "An informational severity message"; BOOST_LOG_TRIVIAL(warning) << "A warning severity message"; BOOST_LOG_TRIVIAL(error) << "An error severity message"; BOOST_LOG_TRIVIAL(fatal) << "A fatal severity message"; } [/cpp]
See Also
Using Boost On Visual Studio Project
To use Boost libraries, set following configurations on Visual Studio project properties:
- Check if boost is already installed (eg: C:\Program Files (x86)\boost\boost_1_51_0) if not, go through the installation process on http://www.boost.org/doc/libs/1_52_0/more/getting_started/windows.html
- Ensure BOOST_HOME environment variable exist and points to the installation path above
- On project properties, under C/C++ -> General, add $(BOOST_HOME) to Additional Include Directories
- Under Linker -> General, add $(BOOST_HOME)\lib to Additional Library Directories
- Ensure C/C++ -> Code Generations -> Runtime Library is set to /MD or /MDd so linker can find boost lib files
Some boost component such as boost log need to be built first before it can be linked:
- Unarchive the downloaded compressed file
- Open command prompt in administrator mode and cd into the unarchived directory. Run bootstrap.bat to build b2
- Run b2 install --prefix=PREFIX --toolset=msvc-10.0 --build-type=complete stage. This will take about 30 minutes, be patient. Note: “PREFIX” is the directory you want to install boost (eg: lib). “toolset=msvc-10.0″ means compile boost by using visual studio 2010.
Generating Visual C++ Crash Dump For Debugging
Detecting cause of problem that occurs only in production environment is hard. For Visual C++ created native windows application, this can be done using DebugDiag tool.
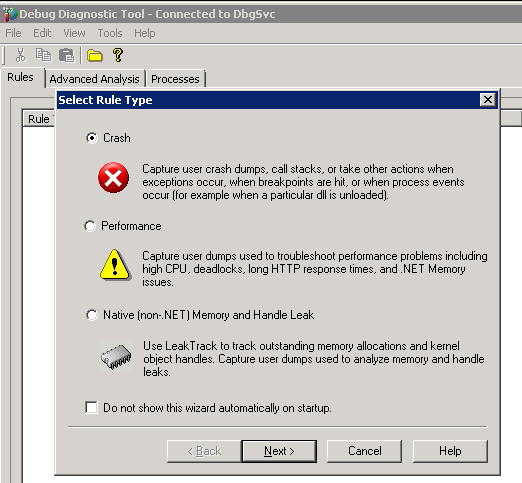
Download and install the tool on the production server, run it, and create a Crash rule type
Select a specific process target:
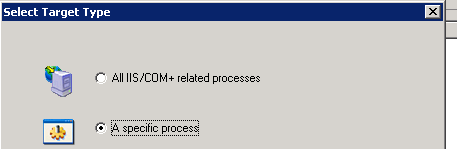
And search for your process
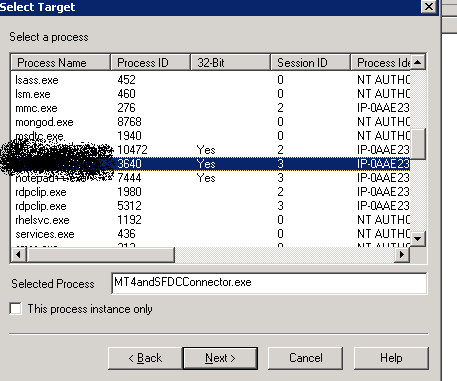
Tick This process instance only if multiple processes with same name are running but you’re only interested in one.
Click next and accept all defaults. Then when the crash occurs, you will get a .dmp file on C:\Program Files\DebugDiag\Logs\Crash rule for process id NNNN folder.
This .dmp file can be copied into your PC and opened in Visual Studio for stack trace analysis. Don’t forget you need to tell Visual Studio where to find the symbol (.pdb) file.
Select Set symbol paths on Visual Studio Action bar and add the folder containing your .pdb file.
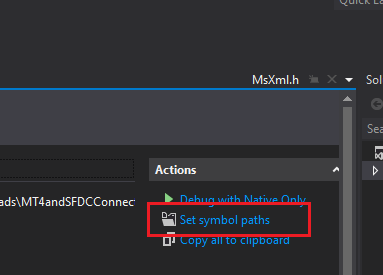
Then start the debugging session by selecting Debug with Native Only. Visual Studio will tell you the stack trace when the crash happens.
Thanks to Ganesh R for providing this solution on Stack Overflow.
Also checkout Microsoft’s documentation on DebugDiag.